Analytics Dashboard
Use SortLab Analytics to track revenue, orders, engagement, collection coverage, sort runs, CTR, add-to-cart rate, and lift.
Analytics starts empty and populates after SortLab begins managing collections and Shopify order, product, and pixel data flows in.
Time Periods
The dashboard supports 7-day, 30-day, 60-day, and 90-day views. Plan limits control which windows are available.
| Plan | Analytics windows |
|---|---|
| Starter | 7d and 30d |
| Advanced | 7d, 30d, and 60d |
| Enterprise | 7d, 30d, 60d, and 90d |
Changing the time period updates KPI cards, charts, lift views, and collection tables together.
Store-Level KPI Cards
At the top of Analytics, SortLab shows:
| KPI | Meaning |
|---|---|
| Total Revenue | Revenue from products in managed collections during the selected period. |
| Orders | Orders containing products attributed to managed collections. |
| Collections Managed | Managed collection count compared with total synced collections. |
| Revenue Opportunity | Estimated upside from unmanaged collections or stronger sorting coverage when enough data exists. |
Revenue Opportunity is an estimate. Treat it as prioritization guidance, not a guarantee.
Revenue Over Time
The revenue chart shows daily revenue for the selected period. Use it to check whether performance changed after a new strategy, schedule, product launch, promotion, or A/B test.
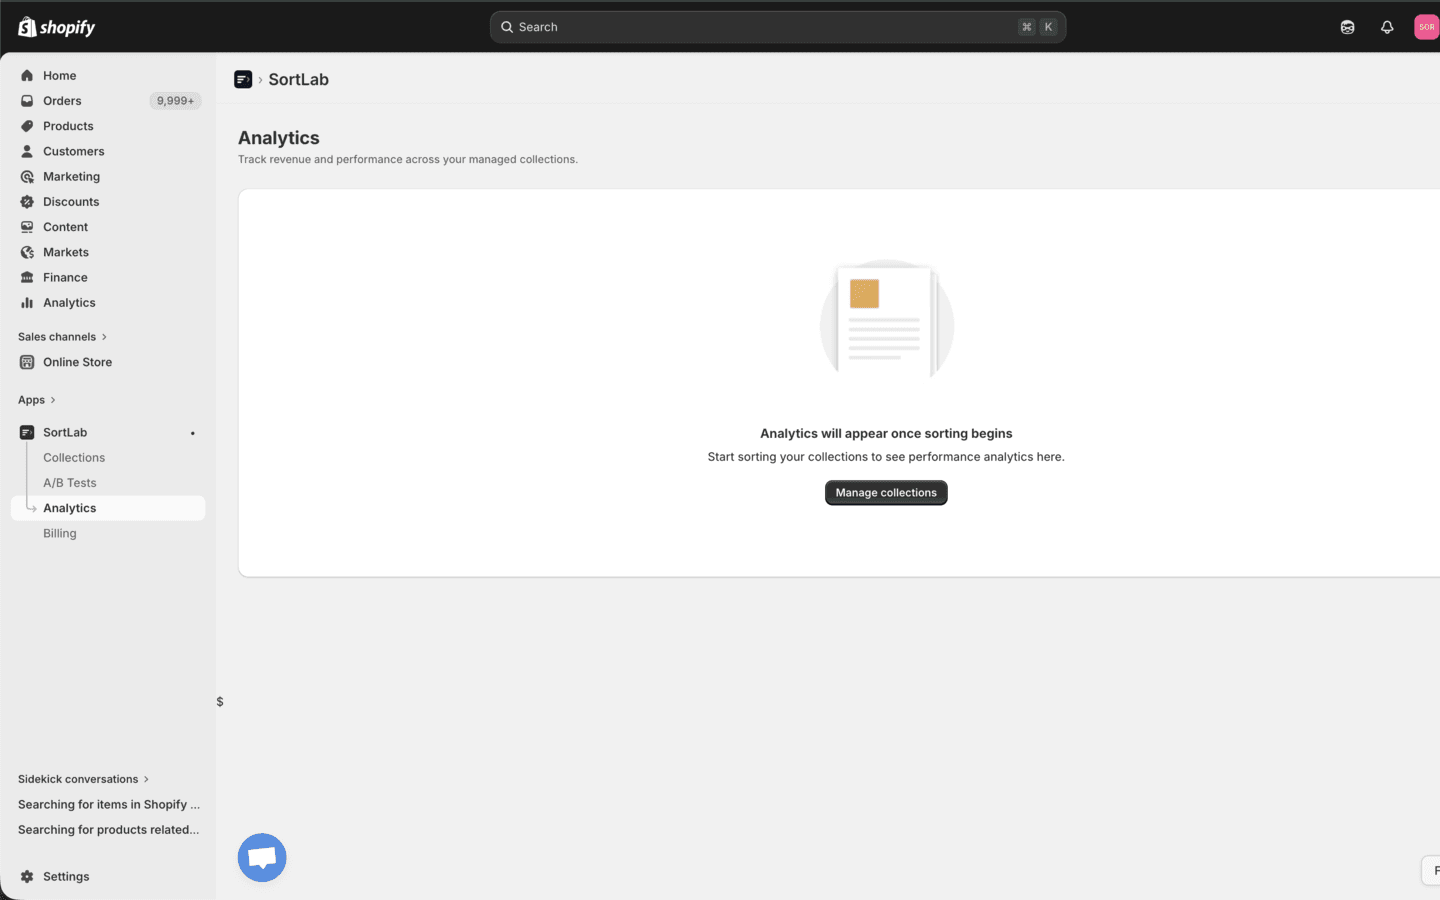
If the chart is empty, SortLab has not yet received enough revenue data for managed collections in the selected period.
Collection Performance Table
The table breaks performance down by collection.
| Column | Meaning |
|---|---|
| Collection | Shopify collection name. |
| Revenue | Revenue attributed to the collection. |
| Trend | Revenue change compared with the previous equivalent period. |
| Orders | Orders attributed to the collection. |
| Units Sold | Units sold from the collection. |
| Sort Runs | Number of manual, scheduled, webhook, or A/B test sorts. |
| Last Sorted | Most recent successful sort time. |
| CTR | Collection click-through rate from the web pixel. |
| ATC Rate | Add-to-cart rate from behavioral events. |
Use search to find a specific collection and sort table columns to identify the strongest or weakest opportunities.
Collection Detail Analytics
Clicking a collection opens a detail view with three tabs:
- Revenue - revenue, orders, units sold, revenue share, sell-through rate, trend, revenue over time, revenue by position, and top products.
- Engagement - collection views, impressions, CTR, add-to-cart behavior, conversion funnel, product engagement, and product-level opportunity hints.
- Sort Impact - cumulative lift, revenue before/after sort runs, CTR before/after sort runs, and sort history.
The detail view is the best place to understand whether a specific collection's strategy is working.
Empty States
Analytics can be empty for normal reasons:
- No collection is managed yet.
- The collection has not been sorted yet.
- No orders have been attributed to managed collections.
- The web pixel has not collected enough impressions, clicks, or add-to-cart events.
- The selected time period is too short for the available data.
Use Manage collections from the empty state to set up sorting.
Measurement Workflow
- Sort a collection and confirm it is active.
- Wait for orders and behavioral events to accumulate.
- Review the 30-day view by default.
- Inspect collections with negative trend, low CTR, low add-to-cart rate, or stale sort runs.
- Use Advanced or Enterprise A/B testing before changing an important strategy.
Next Steps
- Understanding Metrics - Definitions and interpretation details.
- A/B Testing - Compare strategies with controlled tests.
- Scheduling - Keep sort runs current.